
We Had Fewer Signups. Better Customers Barely Made Up for It.
We've had a real drop in DocsBot signups this year.
Not a dramatic overnight collapse. More like fewer people just appearing in the product every day. You can feel that kind of change before a dashboard proves it. The signup notifications are a little quieter. The top of the funnel takes more work. Growth feels heavier.
The comforting version of the story is that customer quality went up.
It did. ARPU and lifetime value climbed enough to cover the gap in signup volume.
Barely.
That last word is the important one. It is easy to look at stronger revenue per customer, declare that moving upmarket worked, and stop asking uncomfortable questions. I wanted to know what was actually happening underneath the healthier averages.
So I dug through our PostHog data and every "How did you hear about DocsBot?" response from our demo bookings.
The answer was not one clean chart. It was two charts that disagreed in useful ways.
Search was still number one, which told me almost nothing
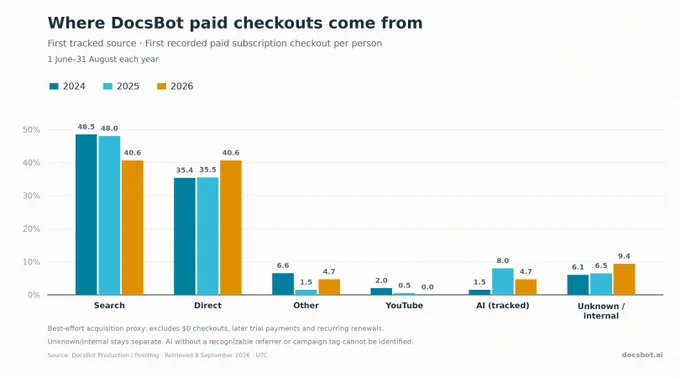
For the first chart, I looked at the first tracked source for each person who completed a paid subscription checkout. I compared January through August across 2024, 2025, and 2026.
Search accounted for 48.5% of those checkouts in 2024. This year it was 40.6%.
That is still a huge share. Search was tied with Direct as our largest measured acquisition source. If I only asked, "What is our biggest channel?" I could honestly answer "Search" and feel pretty good about it.
But a channel can remain number one while the number of people walking through it shrinks.
Percentages hide the size of the pie. If total signups fall, holding a large share of a smaller total does not solve the problem. "Search is still our biggest source" is not the same as "Search is bringing us enough customers."
That distinction sounds obvious when written down. It is surprisingly easy to miss when a dashboard ranks channels from largest to smallest and the familiar one is still on top.
This also made me rethink my one-year SEO report. Search has been enormously important for DocsBot, especially documentation, competitor pages, and useful free tools. None of that work suddenly stopped mattering. The problem is that a channel can continue working and still stop growing fast enough for the business around it.
AI referrals appeared twice, with two very different numbers
Recognizable AI referrals accounted for 4.7% of paid checkouts in the PostHog chart, mostly from ChatGPT.
Then I looked at the answers from people who booked demos.
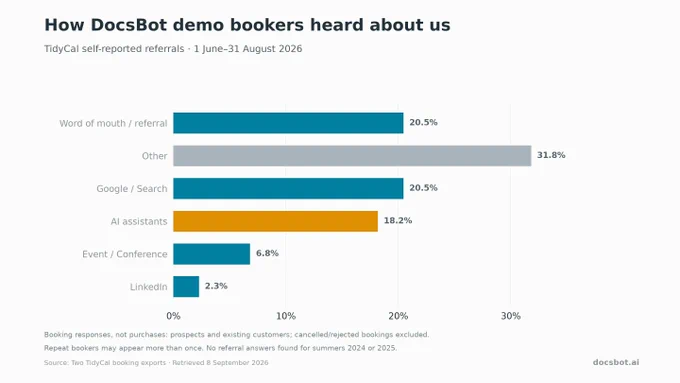
In that data, 18.2% selected "ChatGPT/Claude/Perplexity/etc."
It would be fun to say AI discovery is actually four times larger than our analytics can see. It would also be irresponsible.
These are different groups. The PostHog chart covers first tracked sources for paid checkouts. The booking answers include prospects and existing customers. Some people book more than once. Self-reported discovery also captures influence that a browser referrer cannot, but it depends on a person's memory and interpretation.
So I cannot multiply the tracked AI sales by four and call it attribution.
What I can say is that the gap matters. Someone who books a call may discover and evaluate DocsBot very differently from someone who signs up and buys immediately. An AI assistant might introduce the product, answer comparison questions, and send a person back later through a browser or bookmark. By the time they convert, the measurable source may be Direct.
PostHog derives channel data from entry referrers, UTM parameters, and other click identifiers. That makes it useful, but it cannot recover a recommendation that happened inside a conversation and left no referral signal. Its own web analytics documentation is clear that channel classification depends on the referrer and campaign data it receives.
The 4.7% is real. The 18.2% is also real. They are answering different questions.
Direct is not a discovery channel
Direct grew from 35.4% of paid checkouts in 2024 to 40.6% this year.
That sounds like brand strength, and some of it probably is. More people may know DocsBot by name, return from a bookmark, or type the URL directly.
But "Direct" mostly tells me we missed the referral signal. It does not tell me what made someone type our name into a browser.
Maybe they heard about us from another founder. Maybe an agency recommended us to a client. Maybe ChatGPT included DocsBot in a shortlist. Maybe they saw one of my posts, forgot about it, and came back three weeks later.
Those are completely different acquisition stories hiding inside the same bar.
This is why attribution has become so frustrating. The cleanest-looking category is often the least informative one.
Word of mouth tied Google
The demo responses added another surprise.
Word of mouth and referrals accounted for 20.5% of answers, exactly even with Google and Search.
That deserves at least as much attention as the noise around generative engine optimization. I spend a lot of time thinking about what AI assistants recommend because the behavior is new and changing quickly. Meanwhile, one person telling another person to try DocsBot was just as common as Google among the people who booked time with us.
That is harder to scale with a landing page tweak. It is also a much stronger signal.
People recommend products when the product worked, the company earned trust, or the outcome was specific enough to remember. A referral is not just an acquisition event. It is evidence that something before acquisition went right.
It made me want to spend more time with the customers who fit us well:
- What were they trying to solve when they found us?
- What did they read, watch, or ask?
- What made DocsBot feel worth paying for?
- Who else was involved in the decision?
- What made them comfortable recommending us later?
We have been asking more of these questions lately. They are slower than opening an analytics dashboard, but the answers are much closer to how buying actually happens.
Better customers can hide a shrinking funnel
Our work on customer quality is paying off. Higher ARPU and LTV are not vanity metrics. They made the business healthier and helped us reach $1 million ARR even after growth went flat for a while.
The pricing and positioning changes also gave us more room to spend on acquiring the right customers. I wrote about that after our price increase improved MRR, churn, and lifetime value.
But I do not want "better customers" to become a comfortable story I tell myself about fewer people showing up.
There is a limit to how long revenue per customer can compensate for falling volume. Eventually you need more good customers, not just a better average from the ones who remain.
That is the part these charts could not answer:
How long can improving customer quality cover weakening acquisition?
I do not know yet.
The next measurement has to include retention
The obvious next step is not another traffic dashboard. It is connecting acquisition source to what happens after the first visit.
I want to follow each source through:
- Signup or demo booking
- Trial activation
- First payment
- Expansion
- Retention
That changes the question from "Which channel sent the most people?" to "Which discovery paths created customers who stayed?"
PostHog can keep the first-touch source connected to an identified person, including initial referrer and UTM properties. The important part for us is joining that history to billing and retention instead of stopping at checkout.
Search might send more customers who buy without a call. Referrals might convert fewer people but produce much higher lifetime value. AI discovery might influence deals that look Direct by the time money changes hands. Demo bookings might represent a completely different buyer journey from self-serve checkouts.
Until we connect those pieces, every channel chart is incomplete.
What I learned
The lesson was not that SEO is dead. Search still matters enormously to DocsBot.
It was not that AI referrals have replaced Google. Our own data does not support that claim.
And it was not that fewer signups are fine as long as ARPU goes up. That can be true for a season, but it is not a growth strategy by itself.
The useful lesson was simpler: a metric can improve while the underlying problem gets worse.
ARPU and LTV told me we were attracting better-fit customers. Signup volume told me fewer people were arriving. Channel percentages told me where measured conversions came from. Self-reported answers exposed the influence those measurements missed.
None of the numbers were wrong. None of them were enough alone.
I shared the original breakdown on X because I did not have a clean victory to announce. We made real progress attracting better customers. Now we need to grow the number of them.